Grid Tools
grid_tools is a module to interface with and manipulate libraries of synthetic spectra.
Contents
It defines many useful functions and objects that may be used in the modeling package model, such as Interpolator.
Downloading model spectra
Before you may begin any fitting, you must acquire a synthetic library of model spectra. If you will be fitting spectra
of stars, there are many high quality synthetic and empirical spectral libraries available. In our paper, we use the
freely available PHOENIX library synthesized by T.O. Husser. The library is available for download here:
http://phoenix.astro.physik.uni-goettingen.de/. We provide a helper function download_PHOENIX_models() if you
would prefer to use that.
Because spectral libraries are generally large (> 10 GB), please make sure you available disk space before beginning the download. Downloads may take a day or longer, so it is recommended to start the download ASAP.
You may store the spectra on disk in whatever directory structure you find convenient, provided you adjust the Starfish
routines that read spectra from disk. To use the default settings for the PHOENIX grid, please create a libraries
directory, a raw directory within libraries, and unpack the spectra in this format:
libraries/raw/
    PHOENIX/
        WAVE_PHOENIX-ACES-AGSS-COND-2011.fits
        Z+1.0/
        Z-0.0/
        Z-0.0.Alpha=+0.20/
        Z-0.0.Alpha=+0.40/
        Z-0.0.Alpha=+0.60/
        Z-0.0.Alpha=+0.80/
        Z-0.0.Alpha=-0.20/
        Z-0.5/
        Z-0.5.Alpha=+0.20/
        Z-0.5.Alpha=+0.40/
        Z-0.5.Alpha=+0.60/
        Z-0.5.Alpha=+0.80/
        Z-0.5.Alpha=-0.20/
        Z-1.0/
Raw Grid Interfaces
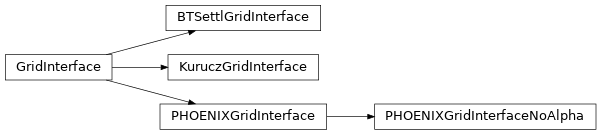
Grid interfaces are classes designed to abstract the interaction with the raw synthetic stellar libraries under a common interface. The GridInterface class is designed to be extended by the user to provide access to any new grids. Currently there are extensions for three main grids:
PHOENIX spectra by T.O. Husser et al 2013
PHOENIXGridInterfaceKurucz spectra by Laird and Morse (available to CfA internal only)
KuruczGridInterfacePHOENIX BT-Settl spectra by France Allard
BTSettlGridInterface
There are two interfaces provided to the PHOENIX/Husser grid: one that includes alpha enhancement and another which restricts access to 0 alpha enhancement.
Here and throughout the code, stellar spectra are referenced by a numpy array of parameter values, which corresponds to the parameters listed in the config file.
my_params = np.array([6000, 3.5, 0.0, 0.0])
Here we introduce the classes and their methods. Below is an example of how you might use the PHOENIXGridInterface.
-
class
Starfish.grid_tools.GridInterface(path, param_names, points, wave_units, flux_units, wl_range=None, air=True, name=None)[source]¶ A base class to handle interfacing with synthetic spectral libraries.
- Parameters
path (str or path-like) – path to the root of the files on disk.
param_names (list of str) – The names of the parameters (dimensions) of the grid
points (array_like) – the grid points at which spectra exist (assumes grid is square, not ragged, meaning that every combination of parameters specified exists in the grid).
wave_units (str) – The units of the wavelengths. Preferably equivalent to an astropy unit string.
flux_units (str) – The units of the model fluxes. Preferable equivalent to an astropy unit string.
wl_range (list [min, max], optional) – the starting and ending wavelength ranges of the grid to truncate to. If None, will use whole available grid. Default is None.
air (bool, optional) – Are the wavelengths measured in air? Default is True
name (str, optional) – name of the spectral library, Default is None
-
check_params(parameters)[source]¶ Determine if the specified parameters are allowed in the grid.
- Parameters
parameters (array_like) – parameter set to check
- Raises
ValueError – if the parameter values are outside of the grid bounds
- Returns
True if found in grid
- Return type
bool
-
load_flux(parameters, header=False, norm=True)[source]¶ Load the flux and header information.
- Parameters
parameters (array_like) – stellar parameters
header (bool, optional) – If True, will return the header alongside the flux. Default is False.
norm (bool, optional) – If True, will normalize the flux to solar luminosity. Default is True.
- Raises
ValueError – if the file cannot be found on disk.
- Returns
- Return type
numpy.ndarray if header is False, tuple of (numpy.ndarray, dict) if header is True
PHOENIX Interfaces
-
class
Starfish.grid_tools.PHOENIXGridInterface(path, air=True, wl_range=(3000, 54000))[source]¶ Bases:
Starfish.grid_tools.base_interfaces.GridInterfaceAn Interface to the PHOENIX/Husser synthetic library.
Note that the wavelengths in the spectra are in Angstrom and the flux are in \(F_\lambda\) as \(erg/s/cm^2/cm\)
- Parameters
path (str or path-like) – The path of the base of the PHOENIX library
air (bool, optional) – Whether the wavelengths are measured in air or not. Default is True
wl_range (tuple, optional) – The (min, max) of the wavelengths, in \(\AA\). Default is (3000, 54000), which is the full wavelength grid for PHOENIX.
-
check_params(parameters)[source]¶ Determine if the specified parameters are allowed in the grid.
- Parameters
parameters (array_like) – parameter set to check
- Raises
ValueError – if the parameter values are outside of the grid bounds
- Returns
True if found in grid
- Return type
bool
-
load_flux(parameters, header=False, norm=True)[source]¶ Load the flux and header information.
- Parameters
parameters (array_like) – stellar parameters
header (bool, optional) – If True, will return the header alongside the flux. Default is False.
norm (bool, optional) – If True, will normalize the flux to solar luminosity. Default is True.
- Raises
ValueError – if the file cannot be found on disk.
- Returns
- Return type
numpy.ndarray if header is False, tuple of (numpy.ndarray, dict) if header is True
-
class
Starfish.grid_tools.PHOENIXGridInterfaceNoAlpha(path, **kwargs)[source]¶ Bases:
Starfish.grid_tools.interfaces.PHOENIXGridInterfaceAn Interface to the PHOENIX/Husser synthetic library without any Alpha concentration doping.
- Parameters
path (str or path-like) – The path of the base of the PHOENIX library
- Keyword Arguments
kwargs (dict) – Any additional arguments will be passed to
PHOENIXGridInterface’s constructor
See also
In order to load a raw file from the PHOENIX grid, one would do
# if you downloaded the libraries elsewhere, be sure to include base="mydir"
import Starfish
from Starfish.grid_tools import PHOENIXGridInterfaceNoAlpha as PHOENIX
import numpy as np
mygrid = PHOENIX()
my_params = np.array([6000, 3.5, 0.0])
flux, hdr = mygrid.load_flux(my_params, header=True)

In [5]: flux
Out[5]:
array([ 4679672.5       ,  4595894.        ,  4203616.5       , ...,
          11033.5625    ,    11301.25585938,    11383.8828125 ], dtype=float32)

In [6]: hdr
Out[6]:
{'PHXDUST': False,
 'PHXLUM': 5.0287e+34,
 'PHXVER': '16.01.00B',
 'PHXREFF': 233350000000.0,
 'PHXEOS': 'ACES',
 'PHXALPHA': 0.0,
 'PHXLOGG': 3.5,
 'PHXTEFF': 6000.0,
 'PHXMASS': 2.5808e+33,
 'PHXXI_N': 1.49,
 'PHXXI_M': 1.49,
 'PHXXI_L': 1.49,
 'PHXMXLEN': 1.48701064748,
 'PHXM_H': 0.0,
 'PHXBUILD': '02/Aug/2010',
 'norm': True,
 'air': True}

In [7]: mygrid.wl
Out[7]:
array([  3000.00133087,   3000.00732938,   3000.01332789, ...,
        53999.27587687,  53999.52580875,  53999.77574063])
There is also a provided helper function for downloading PHOENIX models
-
Starfish.grid_tools.download_PHOENIX_models(path, ranges=None, parameters=None)[source]¶ Download the PHOENIX grid models from the Goettingen servers. This will skip over any ill-defined files or any files that already exist on disk in the given folder.
- Parameters
path (str or path-like) – The base directory to save the files in.
ranges (iterable of (min, max), optional) – Each entry in ranges should be (min, max) for the associated parameter, in the order [Teff, logg, Z, (Alpha)]. Cannot be used with
parameters. Default is Noneparameters (iterable of iterables of length 3 or length 4, optional) – The parameters to download. Should be a list of parameters where parameters can either be [Teff, logg, Z] or [Teff, logg, Z, Alpha]. All values should be floats or integers and not string. If no value provided, will download all models. Default is None
- Raises
ValueError – If both
parametersandrangesare specified
Warning
This will create any directories if they do not exist
Warning
Please use this responsibly to avoid over-saturating the connection to the Gottingen servers.
Examples
from Starfish.grid_tools import download_PHOENIX_models

ranges = [
    [5000, 5200] # T
    [4.0, 5.0] # logg
    [0, 0] # Z
]
download_PHOENIX_models(path='models', ranges=ranges)
or equivalently using
parameterssyntaxfrom itertools import product from Starfish.grid_tools import download_PHOENIX_models T = [6000, 6100, 6200] logg = [4.0, 4.5, 5.0] Z = [0] params = product(T, logg, Z) download_PHOENIX_models(path='models', parameters=params)
Other Library Interfaces
-
class
Starfish.grid_tools.KuruczGridInterface(path, air=True, wl_range=(5000, 5400))[source]¶ Bases:
Starfish.grid_tools.base_interfaces.GridInterfaceKurucz grid interface.
Spectra are stored in
f_nuin a filename liket03500g00m25ap00k2v070z1i00.fits,ap00means zero alpha enhancement, andk2is the microturbulence, whilez1is the macroturbulence. These particular values are roughly the ones appropriate for the Sun.-
load_flux(parameters, header=False, norm=True)[source]¶ Load the flux and header information.
- Parameters
parameters (array_like) – stellar parameters
header (bool, optional) – If True, will return the header alongside the flux. Default is False.
norm (bool, optional) – If True, will normalize the flux to solar luminosity. Default is True.
- Raises
ValueError – if the file cannot be found on disk.
- Returns
- Return type
numpy.ndarray if header is False, tuple of (numpy.ndarray, dict) if header is True
-
-
class
Starfish.grid_tools.BTSettlGridInterface(path, air=True, wl_range=(2999, 13000))[source]¶ Bases:
Starfish.grid_tools.base_interfaces.GridInterfaceBTSettl grid interface. Unlike the PHOENIX and Kurucz grids, the individual files of the BTSettl grid do not always have the same wavelength sampling. Therefore, each call of
load_flux()will interpolate the flux onto a LogLambda spaced grid that ranges between wl_range and has a velocity spacing of 0.08 km/s or better.If you have a choice, it’s probably easier to use the Husser PHOENIX grid.
-
load_flux(parameters, norm=True)[source]¶ Because of the crazy format of the BTSettl, we need to sort the wl to make sure everything is unique, and we’re not screwing ourselves with the spline.
- Parameters
parameters (dict) – stellar parameters
norm (bool) – If True, will normalize the spectrum to solar luminosity. Default is True
-
Creating your own interface
The GridInterface and subclasses exist solely to interface with the raw files on disk. At minimum, they should each define a load_flux() , which takes in a dictionary of parameters and returns a flux array and a dictionary of whatever information may be contained in the file header.
Under the hood, each of these is implemented differently depending on how the synthetic grid is created. In the case of the BTSettl grid, each file in the grid may actually have a flux array that has been sampled at separate wavelengths. Therefore, it is necessary to actually interpolate each spectrum to a new, common grid, since the wavelength axis of each spectrum is not always the same. Depending on your spectral library, you may need to do something similar.
HDF5 creators and Fast interfaces
While using the Raw Grid Interfaces may be useful for ordinary spectral reading, for fast read/write it is best to use HDF5 files to store only the data you need in a hierarchical binary data format. Let’s be honest, we don’t have all the time in the world to wait around for slow computations that carry around too much data. Before introducing the various ways to compress the spectral library, it might be worthwhile to review the section of the Spectrum documentation that discusses how spectra are sampled and resampled in log-linear coordinates.
If we will be fitting a star, there are generally three types of optimizations we can do to the spectral library to speed computation.
Use only a range of spectra that span the likely parameter space of your star. For example, if we know we have an F5 star, maybe we will only use spectra that have \(5900~\textrm{K} \leq T_\textrm{eff} \leq 6500~\textrm{K}\).
Use only the part of the spectrum that overlaps your instrument’s wavelength coverage. For example, if the range of our spectrograph is 4000 - 9000 angstroms, it makes sense to discard the UV and IR portions of the synthetic spectrum.
Resample the high resolution spectra to a lower resolution more suitably matched to the resolution of your spectrograph. For example, PHOENIX spectra are provided at \(R \sim 500,000\), while the TRES spectrograph has a resolution of \(R \sim 44,000\).
All of these reductions can be achieved using the HDF5Creator object.
HDF5Creator
-
class
Starfish.grid_tools.HDF5Creator(grid_interface, filename, instrument=None, wl_range=None, ranges=None, key_name=None)[source]¶ Create a HDF5 grid to store all of the spectra from a RawGridInterface, along with metadata.
- Parameters
grid_interface (
GridInterface) – The raw grid interface to process while creating the HDF5 filefilename (str or path-like) – Where to save the HDF5 file
instrument (
Instrument, optional) – If provided, the instrument to convolve/truncate the grid. If None, will maintain the grid’s original wavelengths and resolution. Default is Nonewl_range (list [min, max], optional) – The wavelength range to truncate the grid to. Will be truncated to match grid wavelengths and instrument wavelengths if over or under specified. If set to None, will not truncate grid. Default is NOne
ranges (array_like, optional) – lower and upper limits for each stellar parameter, in order to truncate the number of spectra in the grid. If None, will not restrict the range of the parameters. Default is None.
key_name (format str) – formatting string that has keys for each of the parameter names to translate into a hash-able string. If set to None, will create a name by taking each parameter name followed by value with underscores delimiting parameters. Default is None.
- Raises
ValueError – if the wl_range is ill-specified or if the parameter range are completely disjoint from the grid points.
Here is an example using the HDF5Creator to transform the raw spectral library into an HDF5 file with spectra that have the resolution of the TRES instrument. This process is also located in the scripts/grid.py if you are using the cookbook.
import Starfish
from Starfish.grid_tools import PHOENIXGridInterfaceNoAlpha as PHOENIX
from Starfish.grid_tools import HDF5Creator, TRES


mygrid = PHOENIX()
instrument = TRES()

creator = HDF5Creator(mygrid, instrument)
creator.process_grid()
HDF5Interface
Once you’ve made a grid, then you’ll want to interface with it via HDF5Interface. The HDF5Interface
provides load_flux() similar to that of the raw grid interfaces. It does not make any assumptions about how
what resolution the spectra are stored, other than that the all spectra within the same HDF5 file share the same wavelength
grid, which is stored in the HDF5 file as ‘wl’. The flux files are stored within the HDF5 file, in a subfile called ‘flux’.
-
class
Starfish.grid_tools.HDF5Interface(filename)[source]¶ Connect to an HDF5 file that stores spectra.
- Parameters
filename (str or path-like) – The path of the saved HDF5 file
-
property
fluxes¶ Iterator to loop over all of the spectra stored in the grid, for PCA. Loops over parameters in the order specified by grid_points.
- Returns
- Return type
Generator of numpy.ndarrays
-
load_flux(parameters, header=False)[source]¶ Load just the flux from the grid, with possibly an index truncation.
- parametersarray_like
the stellar parameters
- headerbool, optional
If True, will return the header as well as the flux. Default is False
- Returns
- Return type
numpy.ndarray if header is False, otherwise (numpy.ndarray, dict)
For example, to load a file from our recently-created HDF5 grid
import Starfish
from Starfish.grid_tools import HDF5Interface
import numpy as np

# Assumes you have already created and HDF5 grid
myHDF5 = HDF5Interface()
flux = myHDF5.load_flux(np.array([6100, 4.5, 0.0]))

In [4]: flux
Out[4]:
array([ 10249189.,  10543461.,  10742093., ...,   9639472.,   9868226.,
    10169717.], dtype=float32)
Interpolators
The interpolators are used to create spectra in between grid points, for example
[6114, 4.34, 0.12, 0.1].
-
class
Starfish.grid_tools.Interpolator(interface, wl_range=(0, inf), cache_max=256, cache_dump=64)[source]¶ Quickly and efficiently interpolate a synthetic spectrum for use in an MCMC simulation. Caches spectra for easier memory load.
- Parameters
interface (
HDF5Interface(recommended) orRawGridInterface) – The interface to the spectrawl_range (tuple (min, max)) – If provided, the data wavelength range of the region you are trying to fit. Used to truncate the grid for speed. Default is (0, np.inf)
cache_max (int) – maximum number of spectra to hold in cache
cache_dump (int) – how many spectra to purge from the cache once
cache_maxis reached
Warning
Interpolation causes degradation of information of the model spectra without properly forward propagating the errors from interpolation. We highly recommend using the Spectral Emulator
-
__call__(parameters)[source]¶ Interpolate a spectrum
- Parameters
parameters (numpy.ndarray or list) – stellar parameters
Note
Automatically pops
cache_dumpitems from cache if full.
-
interpolate(parameters)[source]¶ Interpolate a spectrum without clearing cache. Recommended to use
__call__()instead to take advantage of caching.- Parameters
parameters (numpy.ndarray or list) – grid parameters
- Raises
ValueError – if parameters are out of bounds.
For example, if we would like to generate a spectrum with the aforementioned parameters, we would do
myInterpolator = Interpolator(myHDF5)
spec = myInterpolator([6114, 4.34, 0.12, 0.1])
Instruments
In order to take the theoretical synthetic stellar spectra and make meaningful comparisons to actual data, we need
to convolve and resample the synthetic spectra to match the format of our data. Instrument s are a
convenience object which store the relevant characteristics of a given instrument.
-
class
Starfish.grid_tools.Instrument(name: str, FWHM: float, wl_range: Tuple[float], oversampling: float = 4.0)[source]¶ Object describing an instrument. This will be used by other methods for processing raw synthetic spectra.
- Parameters
name (string) – name of the instrument
FWHM (float) – the FWHM of the instrumental profile in km/s
wl_range (Tuple (low, high)) – wavelength range of instrument
oversampling (float, optional) – how many samples fit across the
FWHM. Default is 4.0
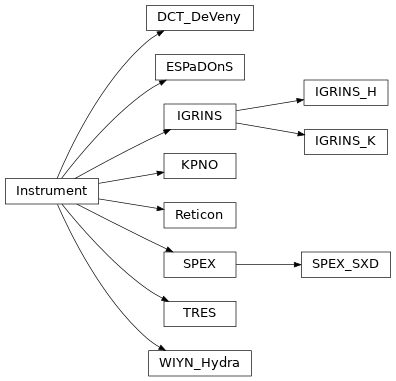
List of Instruments
It is quite easy to use the Instrument class for your own data, but we provide classes for most of the
well-known spectrographs. If you have a spectrograph that you would like to add if you think it will be used by
others, feel free to open a pull request following the same format.
-
class
Starfish.grid_tools.TRES(name='TRES', FWHM=6.8, wl_range=(3500, 9500))[source]¶ Bases:
Starfish.grid_tools.instruments.InstrumentTRES instrument
-
class
Starfish.grid_tools.KPNO(name='KPNO', FWHM=14.4, wl_range=(6250, 6650))[source]¶ Bases:
Starfish.grid_tools.instruments.InstrumentKNPO instrument
-
class
Starfish.grid_tools.Reticon(name='Reticon', FWHM=8.5, wl_range=(5145, 5250))[source]¶ Bases:
Starfish.grid_tools.instruments.InstrumentReticon instrument
-
class
Starfish.grid_tools.SPEX(name='SPEX', FWHM=150.0, wl_range=(7500, 54000))[source]¶ Bases:
Starfish.grid_tools.instruments.InstrumentSPEX instrument at IRTF in Hawaii
-
class
Starfish.grid_tools.SPEX_SXD(name='SPEX_SXD')[source]¶ Bases:
Starfish.grid_tools.instruments.SPEXSPEX instrument at IRTF in Hawaii short mode (reduced wavelength range)
-
class
Starfish.grid_tools.IGRINS_H(name='IGRINS_H', wl_range=(14250, 18400))[source]¶ Bases:
Starfish.grid_tools.instruments.IGRINSIGRINS H band instrument
-
class
Starfish.grid_tools.IGRINS_K(name='IGRINS_K', wl_range=(18500, 25200))[source]¶ Bases:
Starfish.grid_tools.instruments.IGRINSIGRINS K band instrument
-
class
Starfish.grid_tools.ESPaDOnS(name='ESPaDOnS', FWHM=4.4, wl_range=(3700, 10500))[source]¶ Bases:
Starfish.grid_tools.instruments.InstrumentESPaDOnS instrument
Utility Functions
-
Starfish.grid_tools.chunk_list(mylist, n=2)[source]¶ Divide a lengthy parameter list into chunks for parallel processing and backfill if necessary.
- Parameters
mylist (1-D list) – a lengthy list of parameter combinations
n (integer) – number of chunks to divide list into. Default is
mp.cpu_count()
- Returns
chunks (2-D list of shape (n, -1)) a list of chunked parameter lists.
-
Starfish.grid_tools.determine_chunk_log(wl, wl_min, wl_max)[source]¶ Take in a wavelength array and then, given two minimum bounds, determine the boolean indices that will allow us to truncate this grid to near the requested bounds while forcing the wl length to be a power of 2.
- Parameters
wl (np.ndarray) – wavelength array
wl_min (float) – minimum required wavelength
wl_max (float) – maximum required wavelength
- Returns
numpy.ndarray boolean array
Wavelength conversions
-
Starfish.grid_tools.vacuum_to_air(wl)[source]¶ Converts vacuum wavelengths to air wavelengths using the Ciddor 1996 formula.
- Parameters
wl (numpy.ndarray) – input vacuum wavelengths
- Returns
numpy.ndarray
Note
CA Prieto recommends this as more accurate than the IAU standard.